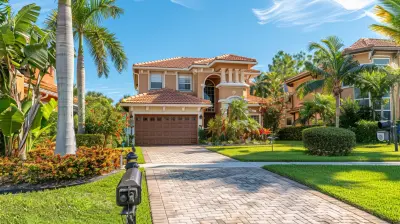
What’s Fueling Home Price Surges Ahead of 2026?
24 October 2026
Home prices rarely move for a single reason. When they climb sharply, as they have in many markets heading toward 2026, the cause is usually a stack of forces pressing on the same lever at once: too few homes for sale, buyers who are less rate-sensitive than expected, incomes that have quietly caught up, migration patterns that redraw local demand maps, and construction that keeps lagging behind household formation.
If you are a buyer trying to time an entry, a seller weighing whether to list, or an investor underwriting a deal, the useful question is not "are prices going up?" It is "which of these forces are structural, which are cyclical, and which are already priced in?" That distinction determines whether today's price is a fair reflection of tomorrow's value or a temporary overshoot you will pay for later.
This article breaks down the mechanics behind the price pressure, separates durable drivers from fragile ones, and gives you a practical framework for reading your own market instead of relying on national headlines.

The Supply Gap Is the Engine, Not a Side Note
Most commentary treats tight inventory as one factor among many. In reality, it is the engine. Everything else either amplifies or dampens its effect.The United States has underbuilt relative to household formation for an extended period following the 2008 financial crisis. Construction employment collapsed, small builders went under, and lending standards for speculative building tightened. The result was a decade of housing starts that did not keep pace with new households, immigration, and the simple fact that existing homes age out of the habitable stock. That deficit did not disappear when demand cooled in 2022 and 2023. It sat there, waiting.
Why does this matter more than any single demand driver? Because housing supply is inelastic in the short run. You cannot conjure a subdivision in eighteen months in most metros. Permitting, entitlements, utility hookups, and labor all take time. So when demand ticks up even modestly, prices absorb the shock rather than quantities. That is the core mechanic behind surge behavior.
The lock-in effect and its slow unwinding
The "lock-in" story is familiar: homeowners who refinanced at 3% rates resist selling to take on a 6% or 7% mortgage, shrinking the resale pool. What is less appreciated is how unevenly this unwinds.Lock-in is strongest among owners who bought or refinanced between 2020 and 2022 and weakest among those with life events forcing a move: divorce, death, job relocation, downsizing. Those forced sellers do list, but they are a small share of the market. As rates drift lower, the gap between a homeowner's existing payment and a new one narrows, and listings gradually return. But this is a slow bleed, not a dam break. Expect incremental improvement in inventory through 2026 rather than a flood.
The practical implication: in markets with heavy 2020-2022 refinancing volume, resale inventory will stay constrained longer than national averages suggest. In markets with more churn, more new construction, or older owner cohorts, relief arrives sooner.
New construction is helping, but not where it is needed most
Builders have ramped up, particularly in the Sun Belt. But there is a mismatch. Much of the new supply is concentrated in higher price points and in exurban locations where land is cheap and entitlements are easier. The entry-level segment, where the supply gap is most acute, remains underserved because the math is hardest there: land, labor, materials, and fees stack up faster than the achievable sale price in many metros.This is why you can have rising completions nationally and still see bidding wars on modest homes in desirable school districts. The supply is real, but it is not fungible. A new build forty minutes from employment centers does not relieve pressure on a three-bedroom near transit.

Demand Has Proven More Rate-Resistant Than Most Forecasters Expected
The consensus in 2022 was that sharply higher mortgage rates would crush demand and force prices down. That happened in some overheated markets, but nationally prices proved sticky and then resumed climbing. Understanding why is essential to judging what comes next.Household formation and the millennial bulge
The largest generation in the workforce is in its prime homebuying years. Millennials are not just forming households; they are forming them later, which means a longer tail of first-time purchases stretching into the late 2020s. Add to that a steady flow of immigration, which concentrates demand in specific metros, and you have a demographic floor under demand that does not care much about a 6.5% versus 7% rate.Cash buyers and equity-rich movers
A meaningful share of transactions involves buyers who are not rate-sensitive: cash purchasers, investors, and move-up buyers carrying large equity from prior sales. When a household sells a home that appreciated substantially and rolls that equity into the next purchase, the mortgage rate matters less because the loan balance is smaller. This insulates a slice of demand from financing costs and keeps competition alive at the mid and upper tiers, which in turn props up the whole ladder.Income growth caught up, briefly
Wage growth in recent years, particularly at the lower and middle of the income distribution, improved affordability at the margin. When nominal incomes rise faster than prices for a stretch, buyers who were priced out re-enter. This is cyclical, not structural. If income growth slows while prices keep climbing, affordability erodes again and demand thins. Watch this variable closely; it is one of the first things to crack.
Migration and the Redrawing of Local Demand
National averages hide the story. Home prices are local, and migration is the mechanism that transmits national forces into specific zip codes.The secondary and tertiary market effect
Remote and hybrid work widened the set of places people can live without changing jobs. That pushed demand into secondary and tertiary markets: smaller metros, college towns, mountain and coastal retreats, and suburbs further out. These markets often have thin inventory and slow permitting, so even modest in-migration produces outsized price moves.The pattern is not uniform. Some pandemic boomtowns overshot and corrected when remote work normalized and rates rose. Others held because the in-migration was driven by retirement, corporate relocation, or genuine lifestyle preference rather than temporary remote arrangements. The distinction matters: migration driven by structural factors (retirement, climate, cost of living arbitrage) tends to stick; migration driven by a temporary policy or work arrangement tends to reverse.
Domestic out-migration from expensive metros
High-cost coastal metros continue to lose residents to lower-cost regions, though at a slower pace than the peak. This creates a two-sided effect: softening at the top of the expensive market and firming in destination markets. For buyers in destination cities, this is a real headwind. For sellers in expensive metros, it argues for realistic pricing rather than anchoring to 2021-2022 peaks.
Construction Costs, Insurance, and the New Cost Floor
Even when land is available, the cost to build has risen structurally. Materials, labor, and regulatory compliance all cost more than they did a decade ago. Insurance in climate-exposed regions has become a genuine affordability issue, and in some markets it is now a bigger monthly line item than the mortgage itself.This creates a cost floor. Builders cannot deliver new homes below a certain price without losing money, so the entry-level new home in many markets is priced higher than the existing entry-level home. That pushes buyers toward the resale market, which is exactly where inventory is thinnest. The result is competition concentrated in the segment least able to absorb it.
There is a second-order effect worth flagging: in markets where insurance premiums have spiked, some owners are choosing to sell or not buy at all, which can cool prices in specific neighborhoods even as the metro average rises. Price surges are rarely uniform within a metro; they are a story of submarkets.
What Is Priced In, and What Is Not
This is where most buyers make their costliest error. They read a headline about surging prices and assume they must act immediately or be priced out forever. Sometimes that is true. Often it is not.The difference between a structural repricing and a cyclical spike
A structural repricing happens when a market's fundamentals change durably: a new employer arrives, transit improves, zoning loosens or tightens, demographics shift. These moves tend to hold. A cyclical spike happens when demand outruns supply temporarily because of rate expectations, speculative buying, or a wave of relocations. These moves often partially reverse.Ask yourself which one you are looking at. If the surge is concentrated in a market with strong job growth, constrained buildable land, and steady in-migration, the higher price may be the new baseline. If it is concentrated in a market where the only change was a temporary rate dip or a remote-work fad, the price may be borrowing from the future.
The rate-expectation trap
Buyers often assume that if rates fall, prices will rise further, so they should buy now. But rate cuts can also bring more inventory to market as lock-in eases, which partially offsets the demand boost. The net effect on price is ambiguous and depends on local supply elasticity. In tight markets, falling rates likely push prices up. In markets with more buildable land and faster permitting, falling rates may bring enough new and resale supply to keep prices flat or even soften them.The lesson: do not treat rate direction as a simple price signal. It is a two-sided force.
A Practical Framework for Reading Your Own Market
National data is a starting point, not a decision tool. Here is how to assess whether your target market is genuinely surging or just noisy.1. Months of supply. Below four months generally signals seller leverage; above six signals buyer leverage. Track the trend, not the snapshot.
2. Days on market and price cuts. Rising days on market combined with more price reductions is an early warning even when median prices still look strong, because medians lag.
3. Permit and starts data. Rising permits signal future supply relief; falling permits signal continued tightness. Look at multi-family versus single-family separately.
4. Employment and wage growth. A market adding high-wage jobs has durable demand. A market adding low-wage service jobs has demand that is more rate- and income-sensitive.
5. Insurance and tax trajectory. Rising carrying costs can offset price gains and deter buyers. Check both.
6. Investor share of purchases. High investor activity can inflate prices short-term and create fragility if financing costs rise or rental yields compress.
Use these together. No single indicator is reliable, and each one can be gamed by seasonality or a small number of transactions in a thin market.
Common Mistakes and Misconceptions
Mistake: Waiting for a crash that never comes. Buyers who sat out 2023 expecting a 20% correction in tight markets missed further appreciation. A crash requires forced selling at scale, which usually requires a job shock or a credit event. Absent that, tight supply tends to produce plateaus, not collapses.Mistake: Assuming all markets move together. A metro can surge while its suburbs soften, or vice versa. Submarket analysis matters more than metro averages.
Misconception: "Prices can't go higher because affordability is stretched." Affordability constrains the pace of appreciation, not the level. Prices can stay elevated and even rise slowly while transaction volume falls. Stretched affordability often shows up as fewer sales, not lower prices, in supply-constrained markets.
Misconception: New construction solves the problem quickly. It helps, but permitting, labor, and infrastructure timelines mean new supply arrives years after the demand shock. And it often arrives in the wrong segment or location.
Mistake: Ignoring carrying costs. A home that looks affordable at the purchase price can be expensive to hold once insurance, taxes, HOA dues, and maintenance are included. In some markets these now rival the mortgage payment.
Trade-Offs Buyers and Sellers Should Weigh
Buy now versus wait
Buying now locks in today's price and rate but may mean paying a premium in a market that is still repricing. Waiting preserves optionality and may capture more inventory, but risks higher prices and competition if rates fall. The right choice depends on your time horizon and local supply elasticity. If you plan to hold for ten years in a supply-constrained market, timing matters less. If you plan to sell in three years in a market with rising permits, timing matters a lot.Stretch to the max versus buy below budget
Stretching maximizes the chance of getting into a desirable area but leaves little margin for rate resets, insurance increases, or income disruption. Buying below budget preserves resilience but may mean a longer commute or a smaller home. In a surging market, the stretch often pays off; in a plateauing one, it can trap you.Sell now versus hold
Sellers in surging markets face a genuine dilemma. Listing now captures peak competition but forces you to buy in the same expensive market unless you are downsizing or relocating. Holding preserves your low-rate mortgage but exposes you to a potential cooling. The calculus depends on whether you are a net buyer or net seller in the same market.What to Watch Through 2026
The forces driving price surges are not static. Keep an eye on four variables that will determine whether the pressure continues, plateaus, or reverses.First, inventory trends. Watch whether listings rise meaningfully as lock-in eases. A sustained increase in active listings in your market is the single most important signal of a shift.
Second, income growth relative to price growth. If wages keep pace, affordability stabilizes and demand holds. If they diverge, demand thins at the margin.
Third, rate direction and its interaction with supply. Falling rates are not automatically bullish for prices if they unlock enough inventory.
Fourth, local policy. Zoning reform, permitting speed, and tax changes can shift supply and demand faster than national trends. A city that upzones aggressively will see different price behavior than one that restricts growth.
Bottom Line
Home price surges ahead of 2026 are not a mystery. They are the predictable result of a long-standing supply deficit meeting demand that turned out to be more durable than expected, amplified by migration, construction costs, and the uneven release of locked-in inventory. The surge is real, but it is not uniform, and it is not permanent in every market.Your job is to separate the structural from the cyclical in the specific market you care about. Use supply, permits, employment, and carrying costs as your lens. Resist the urge to extrapolate national headlines onto your neighborhood. And remember that in housing, the price you pay today is a bet on the balance of supply and demand for the entire time you own the home, not just the next twelve months.
all images in this post were generated using AI tools
Category:
Housing BubbleAuthor:

Mateo Hines
Discussion
rate this article
1 comments
Emery McPherson
Housing demand mixed with low inventory and rising interest rates creates a perfect storm for escalating home prices.
October 24, 2026 at 4:01 AM